The Watershed

On the history of economic and environmental inequality within the Mystic River Watershed and the United States more broadly. Written by Seth Meldon.

Welcome to The Watershed

Leading up to the June 2019 grand opening of Encore Boston Harbor, neighboring residents had mixed feelings about the resort’s façade. Passersby quoted by Beth Teitell, staff writer for the Boston Globe, shared their impressions for an April 2019 story in the paper. “It’s the same color as the lamp in my grandma’s apartment,” one said. Others likened it to “old union hall brown,” “70s car brown,” and “taupe.”1

The patented ‘Wynn Bronze’ glass abuts the Boston skyline, welcoming inbound commuters on Route 93, one of the main arteries into downtown Boston.

image1png

Skyline view of Encore and its surroundings, taken by the author in January 2020

Michael Weaver, the Chief Communications Officer for Wynn Resorts, countered with a multi-part “Well, actually…” defense of the casino’s appearance. He told Teitell that the design was, in fact, iconic enough to be a part of the LEGO Las Vegas architecture set,  that “it creates a very warm, inviting glow inside the rooms” and “offers a beautiful reflection of its surroundings at night.”

The brand’s vision for the resort was, from the onset, cloaked with altruistic motivations; new, well-paying jobs for service workers from the casino’s neighboring communities, among the most diverse and least affluent in the state. Further injections into the local economy via tourism and tax dollars. And of course, the revitalization of a former toxic waste site reviled by its neighbors for the noxious odors it gave off.

image2png

Pre-Project Proposed View of the Casino from the Mystic River, as presented in a 2013 Wynn Resort Expanded Environmental Notification Form2

Indeed, this casino resort is built on a plot of land previously occupied by a series of chemical manufacturers, many of whom had a propensity for allowing manufacturing waste biproducts to bleed into the ground and spread into the surrounding communities. Moreover, the site does not exist in isolation — the 34 acres of surface land on which the Wynn casino is built sits adjacent to the confluence of the Mystic River watershed, the Charles River, and the Boston Harbor.

Situated just outside the ostensibly progressive beacon that is Boston, MA, the earth beneath 1 Broadway in Everett, Massachusetts serves as a comprehensive archive of industrialization’s leftovers. What follows is the origin story of some of these subsurface toxins, their ecological consequences felt throughout one of the most populated watersheds in the country, and the primary victims of the resulting environmental injustices — non-white, low income Bostonians. In this regard, this publication is too in part a defense for Weaver’s contentions — Encore Boston Harbor typifies its surroundings.

image3png

Encore Boston Harbor in Everett, MA within the Mystic River Watershed. Adapted from Mystic River Watershed Association map of Mystic River Watershed, 2019.

The Mystic River Watershed is a distinct land area in Greater Boston. Steven Kolmes, Director of the Environmental Studies Program at the University of Portland, provides a helpful description of the significance of watershed management within developed regions—

Within any geographic region there are areas whose topography determines that they share the same stream and river drainage for precipitation running downhill towards the ocean. Such drainage basins are often referred to as watersheds. Within a watershed a number of distinctive biological communities may exist, as in the common pattern where grassy uplands give way to forested riparian zones along rivers, but these are bound together by a common flow of life's most fundamental molecule... Urban growth challenges watersheds around the world, as mega-cities place huge demands on watersheds that are no longer sufficient to meet increasing needs of growing populations... Watershed level thinking is crucial, as the consequences of alterations to one part of a watershed will inevitably reverberate throughout the rest of the watershed.3

I have organized The Watershed by both geography (north to south) and by social justice construct, as these topics are inextricably linked. The twenty-two communities that are partly or wholly a part of the watershed have remarkable variability between one another with regard to their residents’ income, race, language, and religion. These disparities align disturbingly with the ecological distinctions of the communities, as well as the expected long-term health of their residents. With the outflow of the Mystic River Watershed positioned at its southern end, the accumulation of biochemical waste is most noticeable in the cities closest to the harbor—for citizens with the fewest alternative living options available to them.

image4png

Towns and Cities of Greater Boston4

There are avenues to work towards building a more equitable home for all residents of the Watershed. These residents include all humans, but also all other life along the Mystic River. To create a sustainable, humane future for everyone, it is critical to examine the consequences of our collective histories.

image5png

Green Marker for Encore Casino in Everett, MA.5


Part 1: Marshland to Metropolis

Contents

Encore Boston Harbor overlooks the Mystic River, just upstream from where the river meets the Charles River on its way to the Boston Harbor. The Mystic River is the primary outflow of all water in the Mystic River Watershed — an area of approximately 76 square miles, or roughly 1% of the land area in Massachusetts.6

The watershed partially or wholly encompasses twenty-two communities north and west of Boston. Its headwaters originate primarily in the Aberjona River, which flows through the suburbs of Woburn and Winchester before reaching the Mystic Lake. The upper Mystic Lake flows into the Mystic River, which flows through Arlington, Somerville, Medford, Everett, Chelsea, Charlestown, and East Boston before discharging to Boston Harbor.7

MysticGreenwaysMap_Nov2018-01jpg

Map of Mystic River7

Land degradation — a decline in land quality caused by human activities — is widespread in the Mystic River Watershed. It is not possible to find a parcel of land fully undisturbed by the region’s centuries of settlement and land redevelopment. The land invariably has been tilled, landscaped, excavated, blasted, built upon, or otherwise restructured at some point in the past.

Land degradation results from mismanagement of land and thus deals with two interlocking, complex systems: the natural ecosystem and the human social system8. In The Watershed, I explore the interactions historically between these two systems within the Mystic River Watershed, while referencing various related environmental justice related events, research, politics, and regulation in the United States more broadly.


The First Law of Ecology: Everything Is Connected to Everything Else. The Second Law of Ecology: Everything Must Go Somewhere. The Third Law of Ecology: Nature Knows Best. The Fourth Law of Ecology: There Is No Such Thing as a Free Lunch

–         Barry Commoner9


Land Making

Boston’s land area includes more than 5,000 acres of man-made land — more than any other American city (except perhaps San Francisco, where the landfill hasn’t been comprehensively totaled).4 Boston’s man-made land was not the product of a single concerted effort to expand the city limits, but rather a multitude of unrelated land creation efforts over the centuries, each with its own motivations.^A

More often than not, the original fill used to create this land included contents that today would be deemed inarguably toxic to surrounding natural ecosystems. Pollutants were especially present in bodies of water known as mill ponds — manmade bodies of still water formed from building dams to reroute flowing water through a mill wheel for power. Early city ordinances would encourage, if not outright mandate that abandoned mill ponds be treated as landfills. Boston city records from as early as 1656 document the zoning of one of the city’s mill ponds as a site designated to deposit particularly noxious refuse, such as ‘beast entrails’ disposed of by butchers —

Image

 Retrieved from Documents of the City of Boston,187810 

This was a standard practice in the developing city. National Geographic tells the story of Greater Boston’s largest mill pond, near what is today Haymarket Square—

In the 1640s, a group of businessmen got permission from the city to build a dam across the mouth of a cove on the northern end of the peninsula, so that they could use the tides to power some flour mills. The dam formed what was known as Mill Pond, and the mills were up and running by the end of the decade. But they were never very productive, and the whole operation was sold off to another group by the end of the 18th century.

 The new mill owners closed the floodgates on the west end of the dam, which reduced flow along the banks of Mill Pond. Consequently, sewage, garbage, and the rotting corpses of discarded animals began to accumulate along the shore. It’s unclear whether letting the filth build up was part of their plan, but the new owners soon began lobbying the city to let them fill in the pond and sell off the land.5

Indeed, for many of these projects, little mind was paid to the quality of the fill itself. The land from this dam today helps support the traffic along Causeway Street, and the land on the site of the former pond itself would at the time be known as Bullfinch Triangle. A new building was promptly constructed on the filled land to house the delightfully titled organization, The Society for the Propagation of the Gospel among the Indians6

 bulljpg

Highlighted triangle marking Bullfinch Triangle added to 1891 map of Boston11

Independent of the environmental consequences, the man-made land quickly proved to be ill suited for urban infrastructure. The first ‘made’ land involved dumping sand and gravel on top of Boston’s mud flats, quickly leading to the realization that heavy structures could not be constructed on top of it.

By the turn of the 20th century, city planners had adopted a new strategy for building on the loosely packed land. Laborers would drive wood pilings — essentially vertical logs about the size of telephone poles — through the filled land and underlying organic silt layer (the original mud flats), 15 to 20 feet below existing ground surface12.

brdrjpg

The estimated 1630 Boston shoreline, overlying a 1999 satellite map of Boston and surrounding areas12,13

The wood-piling method of building on top of wetlands introduced new problems for the city as it grew. While the method can be structurally reliable for centuries if left undisturbed, it requires that the groundwater level at no point dips below the tops of the wood pilings. Wood rots at a much slower rate when submerged in environments low in oxygen, and groundwater has markedly lower oxygen levels than water on the surface. As long as the groundwater level never dipped below the tops of the submerged wood pilings, the pilings could theoretically remain sturdy for generations14.

Unfortunately, like most cities, much of Boston’s infrastructure has been built out beneath the ground water level (subways, sewers, tunnels, etc.). When any of these structures are punctured, such as a tunnel springing a leak, the groundwater will drain into it — exposing the submerged pilings to air. The most well-publicized examples of this occurred as a result of the nation’s most expensive highway project ever, Boston’s Big Dig. While the Big Dig is a topic outside of the scope of The Watershed, infrastructure projects like it are one contributing factor to land degradation in the Mystic River Watershed.

This environmental deterioration likely has increased the impacts felt from chemical pollution in the region.


Biochemical Innovation

Boston pioneered and remains today a hub of innovation for the chemical and biotechnology industry. Throughout much of the history of the biotechnology sector’s evolution, regulation has lagged well behind innovation. This is perhaps most evident with respect to regulating manufacturing processes in order to minimize the creation of toxic byproducts. Glenn Nedwin, an accomplished biochemist and co-editor in chief of the journal Industrial Biotechnology, described the challenges presented by early innovations in the biochemical industry at a 1997 conference—

Since the beginning of the Industrial Revolution in the 1700s, industry has not consistently paid attention to the environmental impact of its operations. This inconsistency has grossly intensified since the early 1900s due to a number of complicating factors, including competition driven by capitalism, technological advancements and the need to sustain an increasingly rapid growth in population. Today we are faced with an inordinate number of toxic waste sites due to industrial carelessness and little attention has been paid to energy and resource efficiency.

Historically, most known synthetic reactions were developed primarily on the basis of product yield, with little or no regard for the toxic nature of the starting materials, catalysts, solvents, reagents, byproducts, or impurities. Further, in many instances there was an incomplete technical understanding of the process, no stated set of emissions or waste parameters for operating, lack of detection systems, and in some cases, instances where arrogance, neglect, and greed took over.15

The class structures of each of the Mystic River Watershed’s communities have evolved over the past 200 years, with residents of the cities closer to the harbor today typically experiencing greater levels of economic hardship. Throughout this period, the watershed has withstood a tremendous degree of ecological destruction, amassing an accumulation of hazardous industrial chemical waste deposits spanning generations.

 As will become evident in the subsequent chapters, the combination of land degradation and toxic runoff has come to define the racial disproportionality of these communities.


Extensive information about the making of Boston can be found in Michael Rawson’s Eden on the Charles.

 —-

Part 2: Activism and Epidemic

Contents


It took many fights and a multitude of twentieth-century environmental disasters for the United States’ present-day environmental protections to be enacted. A commonality across these environmental disasters is that residents of the communities impacted by the disasters had to collectively organize to hold polluters accountable and demand regulatory reform. Fighting through the health ailments caused by those same environmental disasters, residents of these communities helped create a public outcry strong enough that regulatory bodies were made to hold guilty corporate actors accountable.*

These crises would eventually lead to the enactment of major environmental regulatory reforms, most notably the Comprehensive Environmental Response, Compensation, and Liability Act in 1980 (CERCLA, also known as the Superfund Program). CERCLA allows the Environmental Protection Agency (EPA) to craft a master plan to restore a ‘Superfund site’ for pollution sites that exceed minimum thresholds defined in the agency’s Hazard Ranking System (HRS). The HRS is a model in which various characteristics of the site, its wastes, and its surrounding environment are combined through use of a numerical algorithm to compute an overall score.16

Sites that qualify as Superfund sites are placed on the National Priority List (NPL), a designation that initiates a judgement by the EPA of the Potentially Responsible Parties (PRPs) who must bear some or all of the costs of that cleanup.17 As of this writing in June, 2020, there are 1,335 sites actively with this designation across the United States, 31 in Massachusetts.

Among the most impactful — and disturbing — of the environmental disasters that caused these reforms was the Love Canal disaster in Niagara Rivers, New York. It created a moral panic that reverberated nationwide, one which served as a case study for the city of Woburn, which faced its own environmental crisis in the same time period.

The Love Canal Disaster

In 1892, William Love received a permit to excavate the Love Canal, blueprinted to stretch perpendicularly from the upper to lower Niagara Rivers. At the time, canals were thought to be a future mainstay for energy creation, and the Love Canal was blueprinted as a major source of hydroelectric energy for a planned housing development. William Love would only make it as far as digging a mile-long trench before abandoning the project in 1910 for lack of funding.

The canal bed was next used as a dumpsite for both municipal and industrial chemical wastes, until the land was purchased in 1947 by Hooker Chemical, a since-shuttered subsidiary of Occidental Petroleum. With the government’s authorization, Hooker alone began using the partially dug canal as a dump site for chemical wastes produced from their manufacturing processes.18 By 1953, the canal was completely filled back in with 20,000 tons of chemical waste. The following decades would bring horror to the residents of Niagara Falls, New York, both bureaucratically and epidemiologically.

1953 — City developers begin building new residences in the growing surrounding community. The Niagara Falls Board of Education, searching for land to build a new school on, sets their sights on the Love Canal land. Hooker volunteered the site for the bargain basement price of $1.00 (just over $9.50 in 2020 dollars) — provided that the new deedholders sign off on a liability waiver which removed Hooker’s responsibility for any potential injury or death stemming from buried chemical wastes. The Board signed off.

image10png

Section of Bill of Sale and Transfer of Property Deed between the Hooker Electrochemical Company and the Board of Education of Niagara Falls, New York, April 28, 1953

Over the next two decades, residents would increasingly report strange odors near the school playground, accumulations of black sludge bleeding through basement walls of the residences along the former Love Canal, and children playing on the school’s playground having sneezing fits and watering eyes. Among these reports—

·         1974 — A couple reports that when they were excavating their backyard for a new pool, the hole they dug immediately filled with rancid blue and yellow liquids. These same chemicals had mixed with the groundwater and flooded the entire yard, reacting so destructively to the redwood posts that one day the fence simply collapsed. When the chemicals receded in the dry weather, the gardens and shrubs looked as though they had been withered and scorched by a brush fire.19

·         March 1978 — The New York State Department of Health (NYSDOH) opens an investigation, first collecting air and soil tests in basements and then conducting a health study of the 239 families living in residences directly encircling the canal. They find an increase in reproductive problems among women and high levels of chemical contaminants in soil and air20.

·         August 1978 — Children living in these homes start to fall ill at an alarmingly frequent rate. Parents organize, demanding that the NYSDOH take action to protect them. The Department ultimately agrees to conduct a more comprehensive investigation, which shows that the contents of the filled-in canal at that point contained over 21,000 tons of toxic chemicals, including at least twelve known carcinogens.21  Among the slurry of carcinogenic chemicals found at the site were benzene, lindane, and trichlorophenol (TCP). But the several hundred pounds of TCP buried in the ground was itself contaminated with Tetrachlorodibenzodioxin or Dioxin for short, known more commonly as Agent Orange — one of the deadliest substances known to man.22

·         December 11, 1978 — Seeing that six construction workers are working on a new development near the Love Canal site, residents organize and form an informational picket to warn the workers of the dangers of exposure to Dioxin. Six picketers are arrested for disorderly conduct.

·         December 12, 1978 — Several of the aforementioned construction workers are hospitalized for mysterious body rashes.

·         August 1979 — Residents begin to leave the neighborhood, citing severe chemical fumes in the area. NYSDOH is mandated to pay food and lodging for 48 hours for families if any family member’s illness was believed causally linked to remedial construction.

·         May, 1980 — State University of Buffalo neurologist says some Love Canal residents may have irreversible nerve damage. Frustrated Love Canal residents, upset by the reports, take two EPA officials hostage in the Love Canal Homeowners Association office and hold them for five hours while demanding evacuation of the entire Love Canal neighborhood.23

·         July, 1982 — State announces high dioxin levels at the canal. EPA soon confirms that the chemical is present in concentrations 100,000 times that found toxic to laboratory animals.23

image11png

An abandoned home bordering the Love Canal site in 1987.7

This environmental disaster had devastating consequences, affecting all aspects of victims’ lives. In 1983 Occidental Chemical, which had bought Hooker, settled $15 billion in claims that had been filed by 1,336 Love Canal residents. It distributed a paltry $20 million lump sum with a $1 million lifetime medical trust to be split by the residents—meaning an average victim received a settlement of $14,250.23

Even if the settlement had been considered acceptable to some victims, they had no way of knowing at the time what the long-term health effects of chronic exposure to carcinogenic chemicals would be.

A 1993 report co-authored by scientists at the Yale University School of Medicine and the New York State Department of Health documented the long-term effects upon residents living near Love Canal and other toxic waste sites.24 Among the 27,000 births by mothers living within 1 mile of New York’s 590 toxic waste sites studied, there was a 12-percent greater chance of giving birth to a child with a major birth defect relative to women living farther from such a site.

90 of the 590 sites were considered to be high-risk locations because there was documented evidence that chemicals had migrated off-site.25 When just these sites were examined, the risk factor soared; women living within one mile of one of these sites were found to have a 63-percent greater chance of bearing a child with a major birth defect relative to women living farther from such a site.

These findings motivated 900 residents to file a follow up suit against Occidental, which resulted in a settlement ranging between $63 to $133,000 in personal injury damages for the victims.23

The disaster served as a case study, though, for communities across the country where residents suspected environmental contamination. Knowledge of the Love Canal case was paramount to the investigations that took place in Woburn, MA just a few years later.


  • While this topic is explored throughout The Watershed, exemplary examples of scholarship in environmental justice advocacy include No Safe Place (Brown and Mikkelson), Toxic Communities (Taylor), Water, Place and Equity (Whitely, Ingram, and Perry), Toxic Nation: The Fight to Save Our Communities from Chemical Contamination (Setterberg and Shavelson)

 —-

Part 3: Activism and Epidemic

Contents

There is a broad counterreformation against health, safety, and environmental regulation. In this insurgent view, most of these matters can efficiently be left to market forces after all, if government will just get out of the way. The fact some concerns about resource shortages were overstated has been used to impeach the need for environmental regulation generally.

~Robert Kuttner, Everything for Sale

The Surveillance, Epidemiology, and End Results (SEER) program at the National Institutes of Health tracks cancer statistics among the U.S. population. Their historical data shows that in 1975 there was an observed rate of 3 new cases — diagnoses, not deaths — of leukemia per 100,000 Americans that were under the age of 20 years old.26 Between 1969 and 1981, Woburn’s population ranged from 36,000 to 38,000.

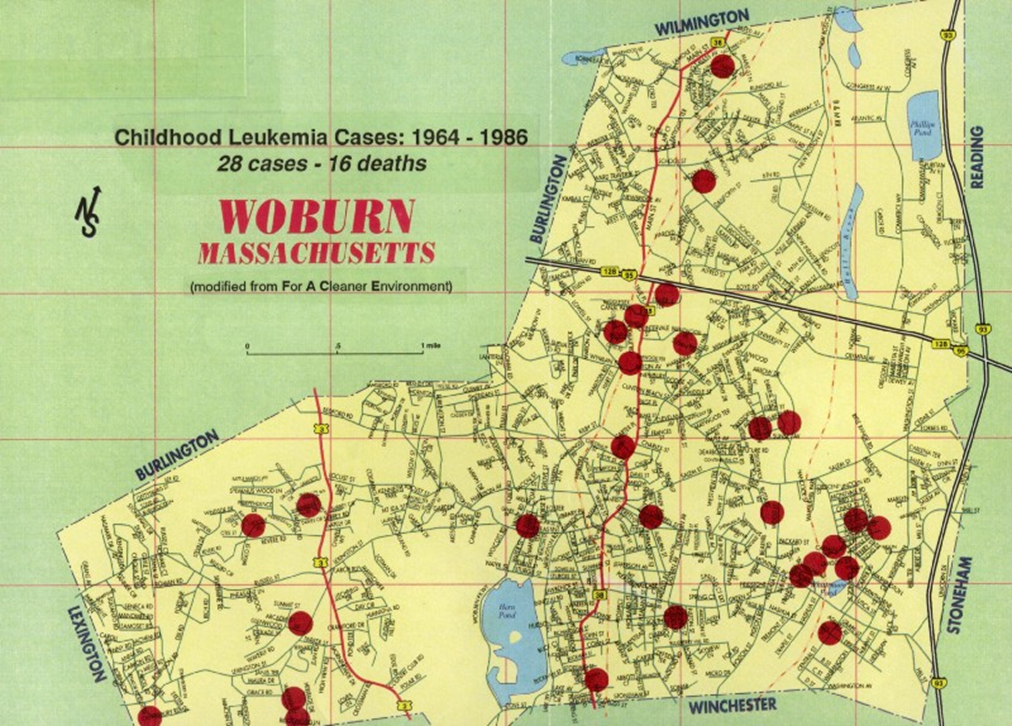
In that time, twenty-eight Woburn children were diagnosed with leukemia. Sixteen died.

image12png

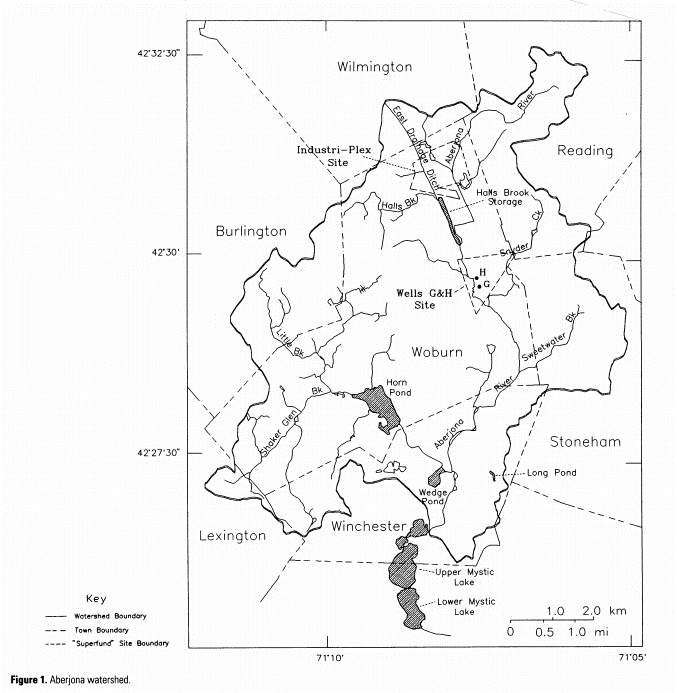
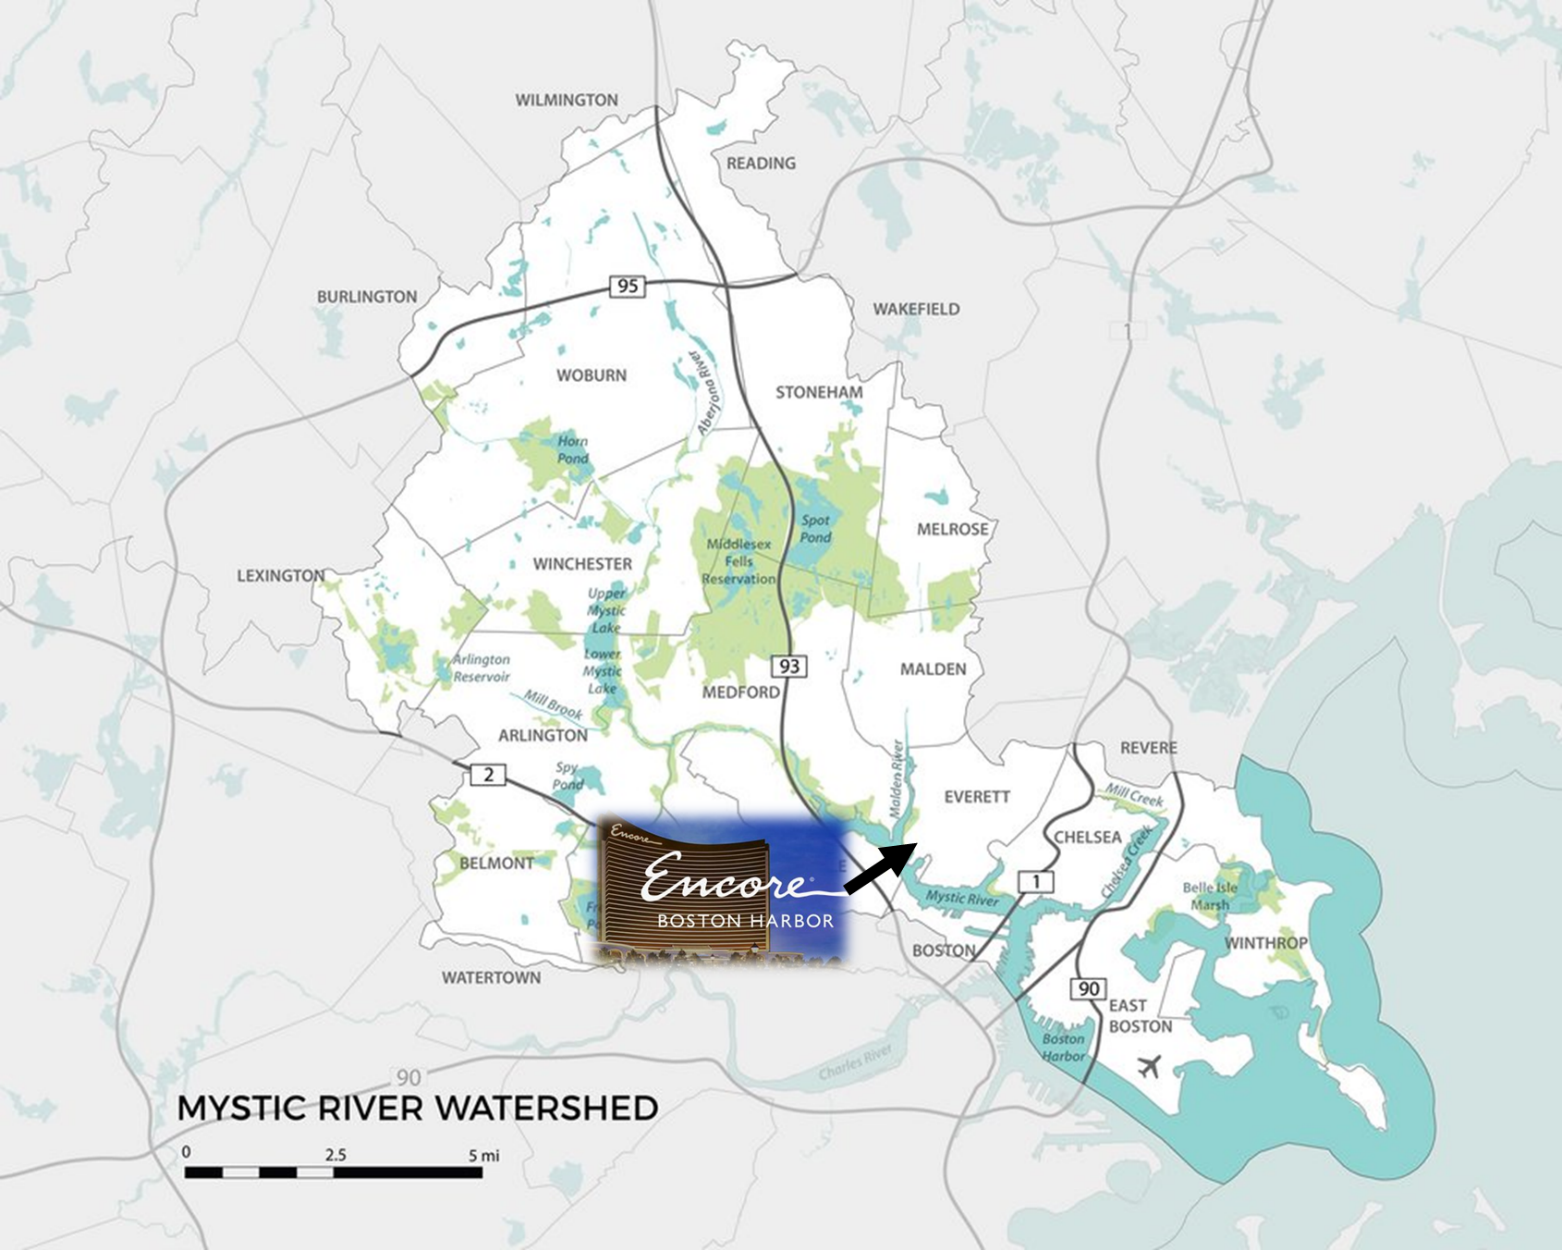
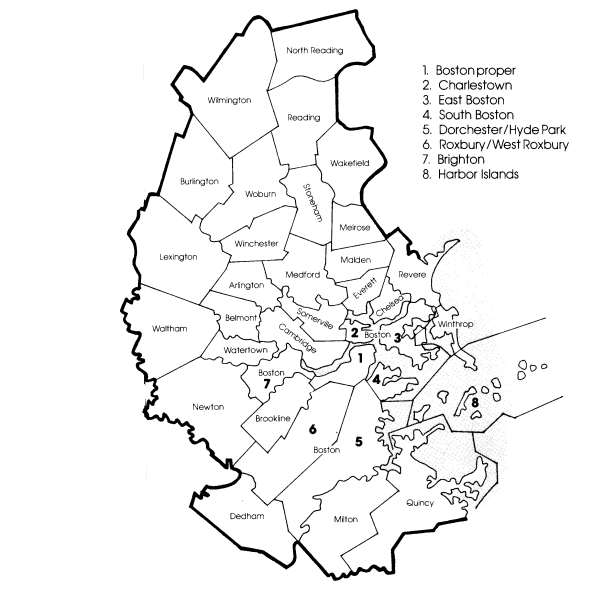
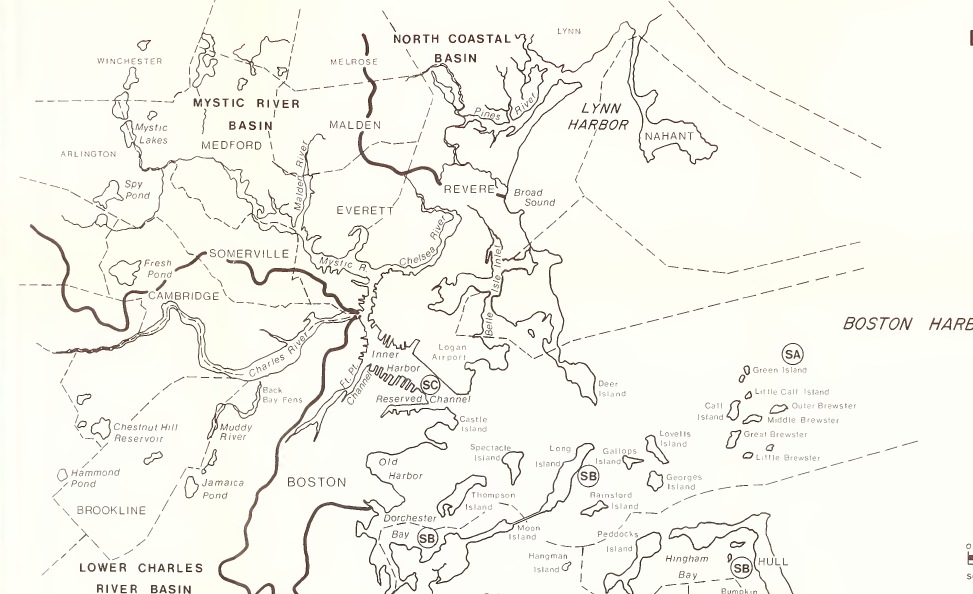
Water bodies and Superfund sites in Woburn, MA 27

The quality of Woburn’s municipal water supply had throughout the twentieth century been the subject of residents’ complaints, made to an array of state and local regulatory bodies. But it was not until popular organizing and advocacy by the victims’ families created the media spotlight needed that regulators began to address the water contamination.

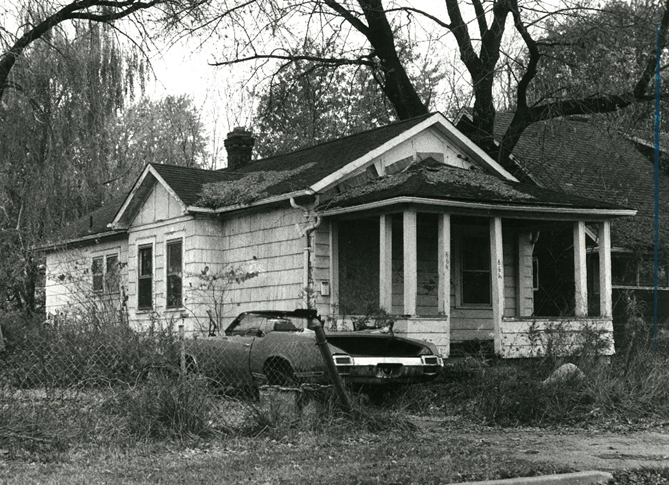
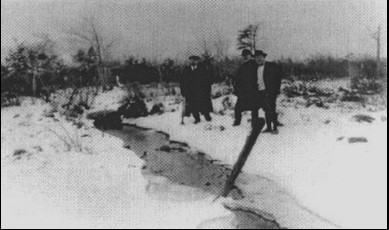
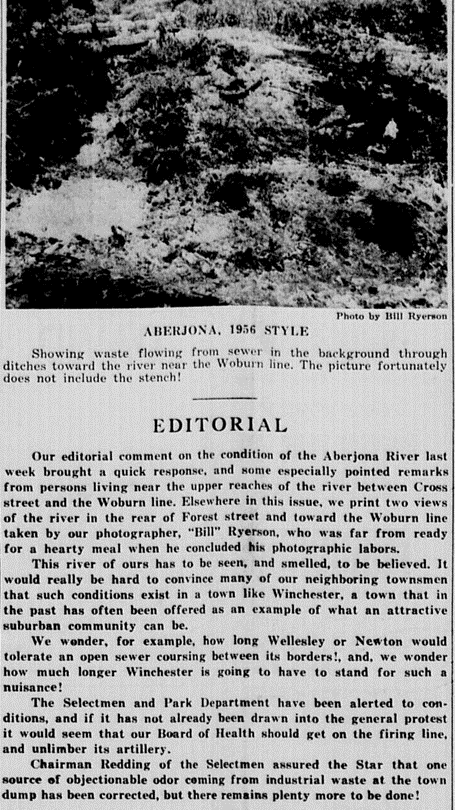
In Paula Diperna’s 1985 book Cluster Mystery, a comprehensive account of the cluster of child leukemia diagnoses and deaths in Woburn, MA, she shared accounts from residents who had grown up in the Boston suburb in the 1950s and 1960s. Some of the residents who had lived near an inlet of the Aberjona River, Hall’s Brook, recounted their experience with the water. One resident described one of the children’s delightful pastimes—throwing ‘mudpacks’ at each other. These chunks of mud along the brook would later prove to be earth, congealed together by chemical residue. 28

Origins of a Mill Town’s Toxic Residue

In 1803, the Middlesex Canal was officially opened, dug over the preceding decade to connect the Merrimac River with Boston Harbor. In the decades that followed, the canal facilitated rapid growth of several profitable industries in Woburn — leather, shoemaking, and dyes. Mills along the Aberjona River would power the factories producing these goods.

From 1827 to 1893, much of the area surrounding Horn Pond was used by the Dow Tannery, the largest leather tannery in the city, at a time when Woburn was one of the leading leather-producing cities in all of the country.29 In her book Woburn: Hidden Tales of a Tannery Town, Marie Coady retells the story of the tannery—

For a time, the tanning of leather implemented natural products such as the bark of trees, plants, etc., but as Woburn became a leading leather producer in the United States and offered much-needed employment, owners began looking for faster and more efficient ways to tan leather. That led to the use of chemical techniques that employed chromium, lead, copper and zinc amalgams that turned the liquor pits into a source of contamination that impacted not only the citizens of Woburn but everyone downstream…As the tannery grew and the techniques of tanning became more volatile, the refuse dumped into Horn Pond became more than anyone bargained for.

image13png

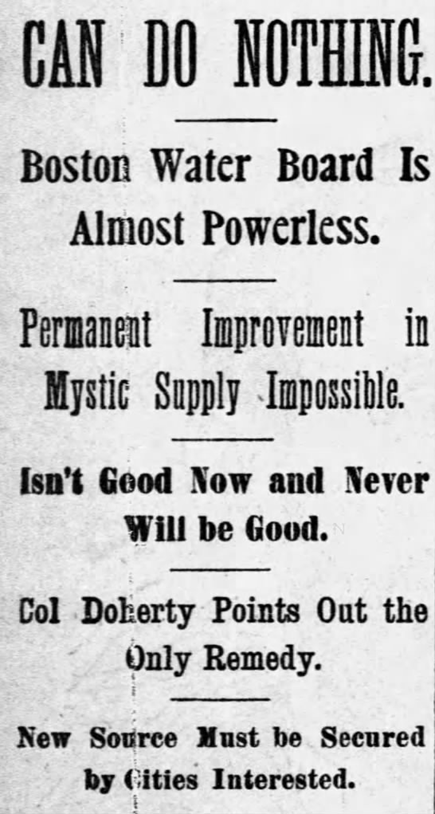
Boston Globe, March 9, 1895, page 6

Woburn residents were falling ill due to the chemical biproducts produced by the very industry that was primarily responsible for the city’s growing prosperity. Coady continues on to document a letter to the editor in the Woburn City Press, published in 1889—

Would it not be wise to take the warning before it is too late, that your children and future generations may not point to you in condemnation, not only because you have allowed such beauty to be despoiled, but because you have allowed it to be polluted into a breeding place of miasma and disease? 29

Mercifully, on April 29th, 1893, the Dow Tannery burst into flames. Residents’ efforts to extinguish the flames were futile—

In the end, the Stephen A. Dow tannery was so badly damaged that it was decided that they would not rebuild. Instead, the very next day they leased the Maxwell tannery in North Winchester and picked up where they left off, making sure their employees were not out of work even one day. For years, the charred ruins of the Dow tannery continued to blight the neighborhood until it finally came under the control of the Metropolitan Parks Commission. The commission, with a great deal of urging from the city, demolished the tannery to make way for the new Woburn Parkway, which opened in August of 1914. But from what I’ve been told by people who lived through that transformation, most of the tannery still exists under the few layers of soil that were used to cover the debris.29


Meanwhile, Woburn’s chemical and dye manufacturing industries were substantially picking up production throughout the second industrial revolution. Woburn Chemical Works, later renamed Merrimac Chemical Company, opened in 1853.30 From 1853 to 1931, Merrimac Chemical and other manufacturers of arsenic-based insecticides, sulfuric acid, phenols, TNT, and chemicals for the leather-tanning industry occupied this area of Woburn.31 Between 1899 and 1914, the Merrimac Chemical Company had grown to become the largest producer of arsenic-based pesticides in the country.⁵

image14png

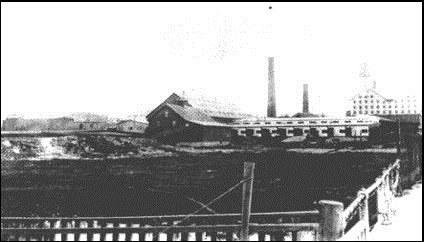
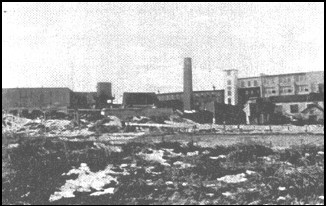
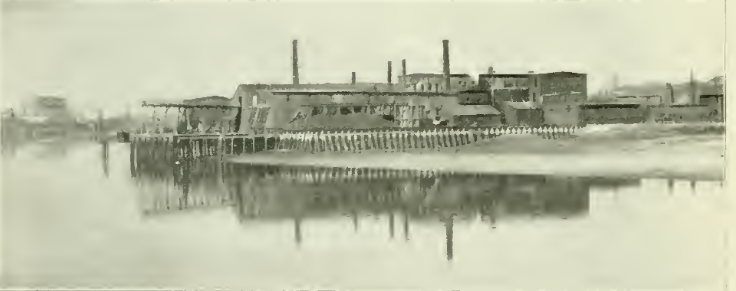
Rear view of the Merrimac Chemical Company 32

The careless disposal by Merrimac Chemical of the wastes from their manufacturing processes gravely impacted surrounding communities. Scientists have estimated that from 1888 to 1929, between 200 and 900 metric tons of arsenic were released into the surrounding ecosystem as a result of pesticide and sulfuric acid manufacturing activities, with approximately 13 metric tons traveling down the Aberjona River to the Mystic Lakes.32

Both residents and regulators were cognizant there was ecological harm being done, but investigations were disjointed. An 1895 examination by the Massachusetts State Board of Health reported that a major source of the town’s public water supply, Horn Pond, was seriously polluted by the tannery and other manufacturing establishments. A follow-up investigation in 1903 reported that the filtration of the water from Horn Pond was becoming less thorough, as shown by the increase in free-flowing ammonia and iron.

By 1906, the Board of Health warned that Horn Pond Brook and its tributaries in Woburn were the “most seriously polluted stream in the water-shed of the Mystic River above Upper Mystic Lake, wastes that entered streams that ran beneath factories or through factory yards as well as by human wastes.”30

image15png

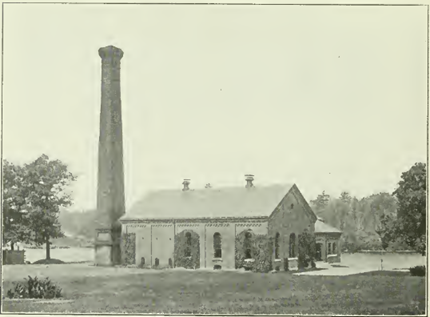
Horn Pond Pumping Station, Woburn, MA 1909 33

In contrast to these observations from the Board, the town’s electric company, the Edison Electric Illuminating Company published a charming brochure about the town in 1909, positing —

The City Water Works supply drinking water of excellent quality. This comes partly from supplementary wells; but mainly from a filter gallery near Horn Pond, a beautiful sheet of water which besides serving its useful purpose is one of the scenic attractions of Woburn. The water is pumped both directly and to a reservoir on Horn Pond Mountain. The supply is always plentiful and there is ample pressure while the thorough distributing system and the more than fifty-seven miles of mains in use make the water generally available…

Various opportunities for outdoor recreation are presented in Woburn. The head waters of the Mystic River are in Woburn, and various ponds or lakes add diversity to the scenery. Horn Pond Mountain and other elevations afford charming views. The vicinity of Horn Pond is attractive while the pond itself is regarded as the best lake for canoeing in Eastern Massachusetts.33


By 1900, Merrimac Chemical had built facilities across more than 400 acres and was one of the largest producers of chemicals in New England.

On Sept. 7, 1923, the MSBH wrote the Woburn Board of Health warning that Horn Pond was “a most objectionable source from which to take water for water supply purposes.”

One resident turned to the Massachusetts House Ways and Means Committee, writing the committee in a letter that, between July and September 1924 —

The City of Woburn had no water fit for human consumption…some chemicals were put into the water to kill the bacteria, which was the cause of much sickness. The more a person drank of the water, the thirstier he would get, so that a person ’s energy was greatly reduced.30

Dependence upon Horn Pond water, however, continued with as much as half of the total amount of the public’s water supply being pumped directly from the pond.

image16png

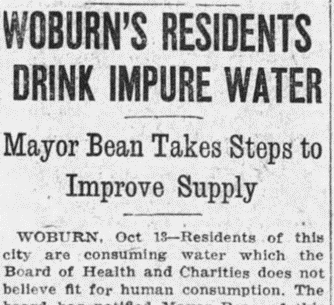
The Boston Globe, Sunday, October 14, 1923

In its 1928 catalog, the Merrimac Chemical Company noted that it deliberately accumulated piles of industrial wastes, with the expectation that a use for the by-product would eventually be discovered. It identified these by-product materials as calcium sulphate, oxide of iron, pyrites cinder, sulphate of lead, calcium carbonate, bauxite waste mud, and “others.”30


Chemical Revolution

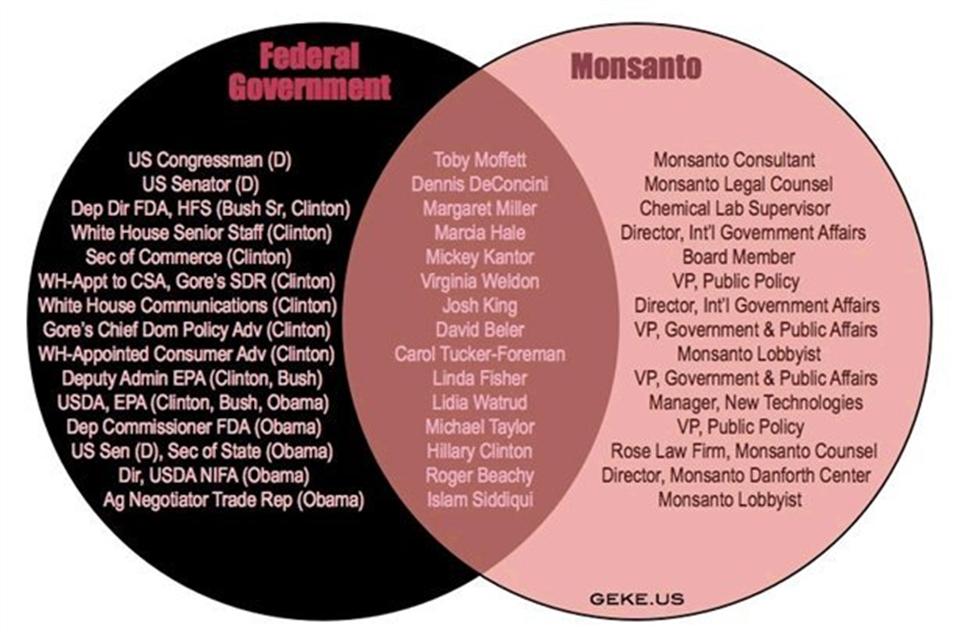
In 1929, Merrimac Chemical was acquired by the Monsanto chemical company. Monsanto maintained the day-to-day operations of Merrimac as one of its divisions until 1934. Among the chemicals Merrimac manufactured pre- and post-acquisition were phenol, benzene, trinitrotoluol (TNT), picric acid, toluene, and sulfuric acid. Then from 1927 to 1968, the site was used to manufacture glue and grease from tanned animal hides.31

By the late 1930s, industrial wastes at the site were piling up—filling lowlands, wetlands, and ponds. These wastes mixed frequently with the municipal sewage that frequently overflowed from the town’s inadequate sewage system.30

After changing hands several more times during these years, the manufacturing complex would ultimately be sold by Stauffer Chemical Companies to a commercial developer, the Mark Phillip Trust (MPT), in 1969.


In the latter part of 1964, Woburn’s Department of Public works activated a new municipal well—”well G,” followed by “well H” in the first half of 1967. Not long after, residents of the neighborhoods served by these wells began reporting strong chemical tastes in their tap water. The water was not even suitable for laundry, as it would ruin the clothing it came in contact with.


In 1965, the town opened a new landfill in a swampy area that drained into a ditch at the northern edge of the Aberjona aquifer. Years later, the mayor of Woburn at the time admitted that the landfill was “never run properly because we dumped into brooks. It should have never been put there because it was in the middle of a wetlands area.”30


In late August 1969, a group of East Woburn residents presented the Mayor with a petition protesting the quality of their water. He agreed to close wells G and H by October 1, but they were reactivated by the following spring due to limits in supply.

Both wells would, over the ensuing decade, follow the cycle of being decommissioned due to taste and quality complaints, only to be recommissioned shortly thereafter due to supply shortages.30


Meanwhile in 1970, at the site formerly owned by Merrimac Chemical, then by Monsanto, then by Stauffer Chemical Companies, the Mark Phillip Trust initiated plans to build an industrial park called IndustriPlex 128, named after nearby route 128. The IndustriPlex site was located just north of G and H.

mappng

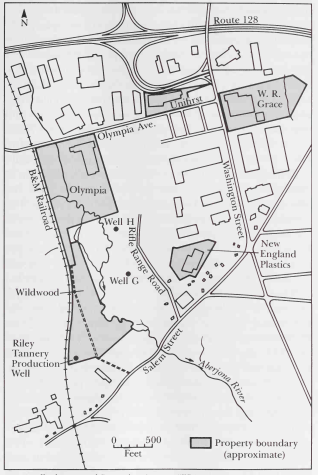
Contaminated Wells and Nearby Industrial Contamination Sites 34

As the MPT excavated the land, they extracted buried animal glue manufacturing wastes, which released a very strong and pervasive “rotten egg” odor. Despite repeated citizen complaints and notices of violations issued by the Massachusetts Department of Quality Engineering (MDQE), the MPT continued its development of the site.35 In doing so, pockets of stockpiled wastes leached into nearby soils, ponds, and wetlands, while hydrogen sulfide gases entered into the atmosphere.36

After repeated violations of the DEQE’s administrative orders, the Massachusetts Office of the Attorney General filed suit against the MPT on behalf of the DEQE. In 1977, the Superior Court issued an order prohibiting the MPT from disturbing two small parcels of land where the bulk of the remaining glue manufacturing wastes were believed to be buried.36 The order did not address the substantial odor and runoff produced by animal wastes that the MPT had already excavated and stockpiled.35


Residents in the section of Woburn served by wells G and H were growing increasingly uneasy, but not simply from their concerns with the smell of their tap water, or the fact it would stain their clothing. During the summer of 1979, nationwide publicity about the Love Canal toxic waste dump coincided with extensive local publicity about possible environmental hazards in Woburn, causing some local residents to wonder if the town's cancer rates there were higher than average—in the ten years between 1969 and 1979, the town saw twelve diagnoses of child leukemia.37

At the urging of a Woburn doctor, the Massachusetts Department of Public Health (MDPH) and the Centers for Disease Control (CDC) conducted an investigation which confirmed a significantly elevated incidence of childhood leukemia in Woburn. Twelve cases were observed in the town, where 5.3 cases were expected in the ten-year stretch. Nine of the twelve children diagnosed had acute lymphocytic leukemia, and all cases were diagnosed before the patients reached 15 years of age.38

Furthermore, at the time of diagnosis, the leukemia cases were concentrated in the eastern part of Woburn, just north of Walker Pond. Six of the victims lived within the borders of census tract 3334, in an area approximately a half-mile in radius. The CDC report documented that the expected probability that 6 or more of the town’s 12 cases would occur in this area, which contained only 17% of the town's population in the 1- to 14-year-old age group was less than 0.01%. The six cases in this census tract were 7.5 times higher than expected.

Childhood leukemia incidence for the rest of Woburn was not significantly elevated.38

image18png

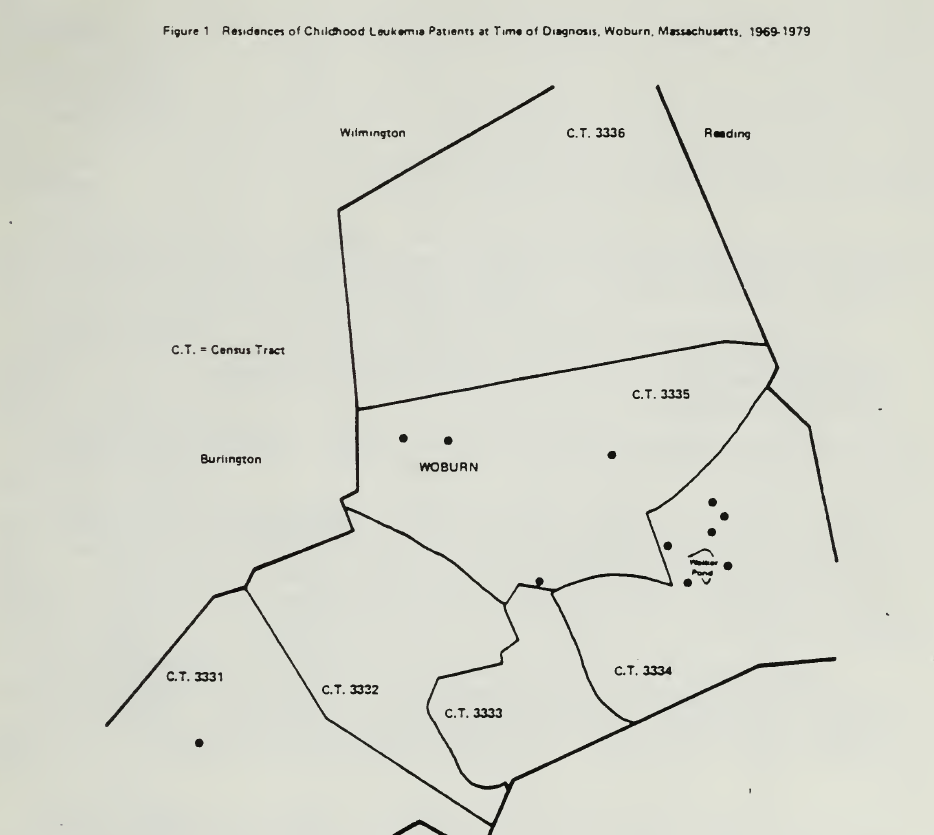
Residences of Childhood Leukemia Patients at Time of Diagnosis in Woburn, Massachusetts from 1969 to 1979 38

The findings only validated what had by then become clear to Woburn residents—something within their surrounding environment was contributing to—if not outright causing— the tragic losses of children in the community to specific kinds of leukemia.

Anne Anderson, a Woburn resident whose son Jimmy’s short life was spent battling the leukemia until he succumbed to it at age 12, was among the first to suspect the correlation—a suspicion that was met for years with broad skepticism until the evidence was indisputable. When asked about the ordeal for a 2004 report to the EPA about the Woburn disaster, Anderson was quoted—

From the time we moved here, the water was bad in the summer. It had an unpleasant odor and a terrible taste. My mother brought jars of MDC water when she came to visit. The kids used to always ask for ‘Nana water.’ It was like a mother’s milk, for God’s sake. She still brings it when she visits.


After the CDC report was released, Anne Anderson and other residents formed a community advocacy group they called For a Cleaner Environment (FACE). Anderson alone could not have forced the state government to take further action; community organizing was critical to advancing their critical situation onto the national media’s radar.

A 1981 study entitled Woburn: Cancer Incidence and Environmental Hazards 1969-1978 by the CDC and the Massachusetts Department of Public Health confirmed the presence of elevated levels of kidney cancer and childhood leukemia in Woburn. But the study’s Conclusions section led with the following two paragraphs—

The information gathered thus far fails to provide evidence establishing an association between environmental hazards and the increased incidence of childhood leukemia and renal cancer in Woburn. Interviews with parents of leukemia cases, two groups of matched controls, and family members of renal and liver cancer cases revealed no associations between environmental factors and the disease.

The investigation has established that the overall incidence of childhood leukemia was significantly elevated in Woburn and that there was a significant concentration of cases in one particular area of east Woburn. The hypothesis suggesting that the increase in leukemia incidence was associated with environmental hazards in Woburn, and specifically with the contamination of drinking water supplies, is neither supported nor refuted by the study findings.39

The study concluded nothing, as the study’s data for 1969-1978 was compared with the data from the years prior to 1969, which did not exist. (Notably, the American Cancer Society still categorizes chemical contamination of groundwater as an “Uncertain, unproven, or controversial risk factor” for childhood leukemia.)

The affirmation of the injury inflicted upon the residents accompanied by the state’s inaction fueled FACE’s community organizing. Seven months after their initial meeting, FACE convened a group of state and federal agency representatives to discuss the plight of Woburn residents. At that meeting, the EPA agreed to investigate the wells.40


While the extent of the public health crisis was being determined by federal, state, and local health department investigations, environmental regulators faced the formidable task of testing the soil throughout the town for a multitude of contaminants, and then tracing their source(s). The undertaking would only grow more challenging, as their investigations uncovered several more toxic waste sites in Woburn.

On May 4, 1979, in a vacant lot next to the Aberjona River, construction workers found 184 abandoned polyurethane barrels containing unknown substances near the newly constructed IndustriPlex, and reported this to the MDPH. The department’s director, Richard Chalpin, fully aware of the Love Canal disaster, knew immediately to be concerned about the nearby groundwater. He called for testing of the nearby public drinking supply wells, which revealed the presence of toxic metals including arsenic, lead and chromium.

The DEQE, who had been trying to shut down the construction of the IndustriPlex, began to test water from the wells as well. On May 22, they informed the Woburn Board of Water that analyses of water samples from wells G and H indicated “the presence of trichloroethylene (TCE) concentrations of 117.6 parts per billion in the sample from well H and 267.4 parts per billion in a sample collected from well G respective.”30 At time of this writing, the EPA’s maximum allowable level of TCE in drinking water is 5 parts per billion.41 It is considered a carcinogen by all routes of exposure.42

The contamination of the water in these wells G and H, though, did not solely originate from the businesses located in their immediate vicinity.

In July 1979, EPA field investigators discovered an abandoned lagoon, spanning nearly an acre in surface area with depths of up to 5 feet. Within it was a slurry of toxic materials including lead and arsenic, the latter in concentrations as high as 1,050 parts per million. The investigators estimated that these materials had been deposited into the ground by manufacturers between 1899 and 1915.38

These chemical deposits were unrelated to the already documented pits of buried animal hides and slaughterhouse wastes that were discovered earlier that summer.

image19png

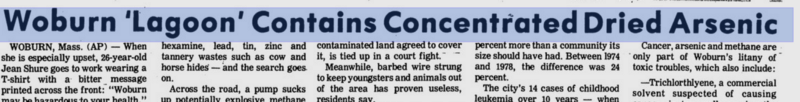
The Virgin Islands Daily News, 1980

The EPA identified the MPT and a group of 25 other businesses as being partially responsible for the ecological damage to the area around the IndustriPlex. The businesses, collectively called the Site Settling Defendants, entered into Consent Decrees with the EPA. Consent decrees under the Superfund act constitute a judgment that binds the parties who sign the decree, but are not an admission of liability.43

Citing the inability to generate sufficient capital, the MPT was the sole party not to have complied with the conditions of the Consent Decrees.35,36

image20png

Source: For a Cleaner Environment (FACE, 1986)36

Living near environmental waste sites has measurably grave consequences, shown in longitudinal studies of the residents of Woburn, Niagara Falls, and communities that have faced similar levels of environmental contamination.

There are countless challenges faced by victims of these communities in holding polluters accountable, but also consider that it is far easier to document changes to the health of those who are already born than to prenatal victims.

There is significant research into how genetic development of the human body is impacted depending on where the mother lives. No organism, including humans, has a destiny independent of its environment, writes Dan Agin, professor of Molecular Genetics at the University of Chicago in his 2010 book, More than Genes. Agin details the findings of one such study—

In 2003, researchers reported a study of 48,197 mothers and their 59,397 children. The children were followed until age 7, and the group included 623 twin pairs. The report concluded that in poor families nearly all the variance in IQ is accounted for by a combination of effects in both the prenatal and post-natal environments, and that the contribution of genes to IQ variance in such families is close to zero. In contrast, in affluent families, the result is almost the reverse. The implication is that among poor children genetic differences contribute almost nothing to the measured variance of IQ because environmental damage, both prenatal and postnatal, overwhelms all other variables in accounting for IQ variation.

In contrast, in the middle and upper classes, in which prenatal and postnatal damage to the nervous system is much reduced and hardly variable from one family to the next, genetic differences account for most of the variation in IQ. In plain language, for middle- and upper-class children, differences in IQ can be explained mostly by genetic differences, while in lower class children, differences in IQ are explained mostly by nongenetic differences (prenatal and postnatal environments).44

Furthermore, one’s mere proximity to hazardous waste sites presents myriad routes of exposure to the human body. A growing body of evidence suggests that there is a measured impact that one’s housing and neighborhood has on their health outcomes, some exacerbated by whether one is able to afford amenities such as air conditioners to filter air particulates.45-52

image21png

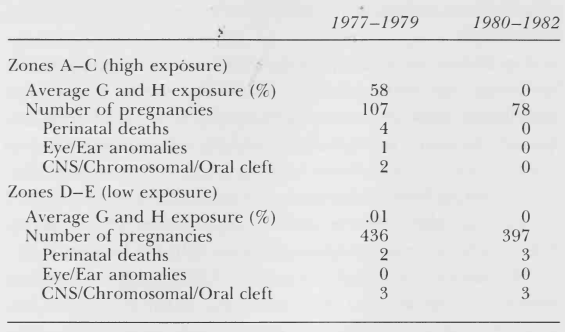
Adverse Pregnancy Outcomes in Areas of High and Low Exposure before (1977-1979) and after (1980-1982) Closure of Wells G and H 34,53


Causal Indeterminacy

By the time the victims of the water contamination had been able to put together a plausible case, the defendants were too numerous for any one party to be proven responsible, and many guilty parties had long since departed.

Eight families organized to file a class action lawsuit in 1982 against the owners of the land from which the majority of the municipal well contamination had originated. Children in seven of the eight families had contracted leukemia, the eighth lost her husband to it. Five of the children died from leukemia or complications of having leukemia. The spouse of one plaintiff contracted acute myelocytic leukemia and died.

While the court case proceeded, FACE continued its advocacy and held numerous public meetings to mobilize community leaders and local residents.40 One member interviewed for Brown and Mikkelson’s No Safe Place stated—

[FACE] accomplished an awful lot, and it has given credibility to this kind of problem. And it has given people courage to stand up and make noise about something that they think is wrong in their community, and get attention.34

sitegif

Source: Harvard University54

The defendants were W.R. Grace & Co., UniFirst Corporation, and Beatrice Foods, Inc.¹² Journalist Dan Kennedy reported on the case throughout its proceedings, often critical of the families’ counsel, Jan Schlichtmann. In 1998, he outlined Schlichtmann’s reasoning for naming the defendants—

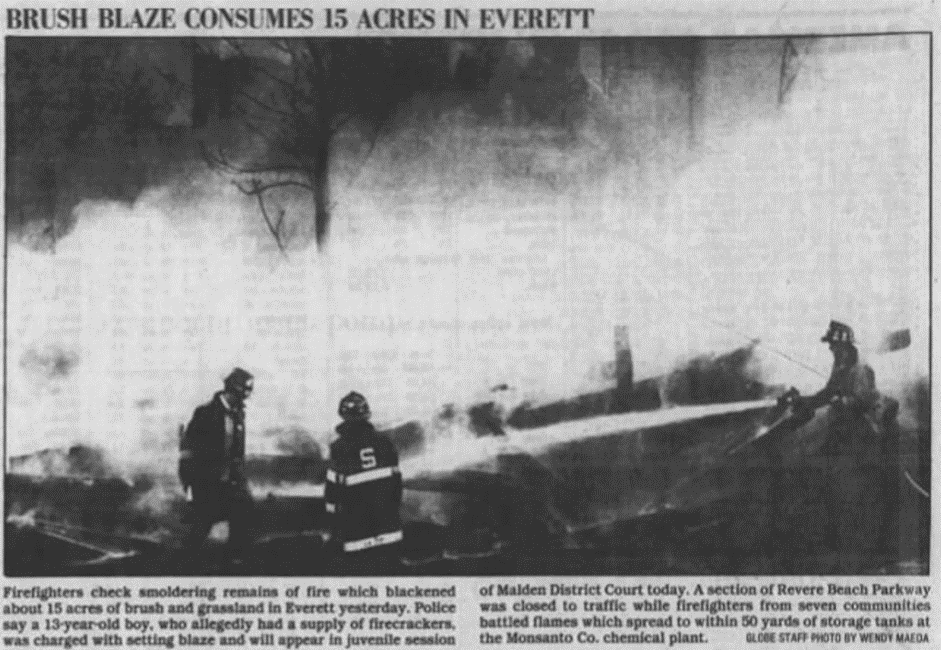
Grace owned a plant that manufactured food-packaging equipment under the Cryovac brand name, and used TCE to clean tools and thin paint…Beatrice purchased the John J. Riley Company tannery — and Riley’s legal liability — just a few months before the wells were shut down. A 15-acre undeveloped property adjacent to and owned by the tannery was heavily contaminated, and Schlichtmann tried — with little success — to show that the tannery itself (and thus Beatrice) was responsible. UniFirst operated a dry-cleaning plant that used PCE.55

Despite it being a civil case — meaning the victims would only need to show the jury that the majority of the evidence pointed to the defendant being liable — the lawsuit faced significant hurdles and in the eyes of some, a suspiciously adversarial judge in Walter Skinner.

For the first five months of the trial, the Woburn families would be forbidden from making any public comment due to a gag order placed on them by Judge Skinner. He ultimately lifted the order only after complaints from the Massachusetts Civil Liberties Union were publicized in the media.34

Due to the Skinner’s decision to bifurcate the lawsuit, the residents’ legal team would first need to show the jury that the defendants’ properties were the likely origin point of the toxic chemical that had contaminated the two wells. If successful, they would then need to show that the children’s deaths from leukemia were attributable to the contamination.32 Finally, that injury would need to be assigned some dollar value in damages. Crucially, this meant that for the proceedings to even reach the portion of the trial focused on damages to the residents’ health, the plaintiffs would first need to demonstrate the defendants’ culpability.

image23png

Woburn Daily Times Chronicle, 198656

Years later in 2009, author Paul Kix wrote for Boston magazine about the challenges presented to Schlictmann by the judge and the opposing counsel—

Jerome Facher, a senior partner at the Boston law firm Hale and Dorr and a lecturer at Harvard Law School, convinced Judge Walter Skinner to break the immensely complicated trial into two parts. Officially, it was Skinner’s decision; such was the case’s complexity, he reasoned. But the bifurcation benefited Facher and the defense attorneys for W. R. Grace in two ways.

First, it gave the defense teams two trials, which put an added burden of proof on Schlichtmann. The first phase of the trial would test the scientific validity of the plaintiffs’ claims. Were the tannery and W. R. Grace responsible for the wells’ contamination? If the jury believed that, the case would move on to the next question: Were the chemicals in the water responsible for giving the children cancer?

Second, delaying the medical portion meant Schlichtmann couldn’t put the Woburn families on the stand until the trial’s latter phase. Their tragic losses were his most compelling pieces of evidence. And now, if he wasn’t successful in the first phase, the families wouldn’t take the stand at all.

Facher worked to ensure that. The trial opened in March 1986 and lasted until late July—79 days of testimony, evidence, and Facher’s objections and ruthless cross-examinations. Already Facher had succeeded in taking a case about dying children and turning it into one of soil samples and river flow, with academics making competing, esoteric claims.57

The lawsuit went poorly for the plaintiffs by virtually any measure, though in retrospect there were likely few winning strategies.

Consider the evidence required to show that the environmental wastes, deposited by a multitude of parties, had more likely than not caused the children’s leukemia. Legal scholar Robert Blomquist wrote about the case for the Cornell Law Review in May 1996, documenting the challenges presented by the case having had both an ‘indeterminate plaintiff’ and an ‘indeterminate defendant.’

One of Jan Schlichtmann's principal problems in litigating the Woburn case was identifying all of the “victims,” and potential tort plaintiffs, of the hazardous waste groundwater contamination out of Woburn's total population of 36,000… Perhaps the genetic background of the children had initiated the leukemias. Maybe health habits (such as the quality of diet, exercise and medical care)had triggered the disease in some of the children. It was also conceivable that some or all of the Woburn leukemia cases had been caused by other environmental exposures such as toxins in the air or suspected carcinogens in common household products, unrelated to the elevated levels of chemicals found in the east Woburn groundwater. Similarly, because of the latent and chronic quality of many toxic injuries, Schlichtmann could not be sure that everyone actually harmed by the contaminated well water knew that they had, in fact, been harmed…

In addition to the problem of indeterminate plaintiffs, another of Jan Schlichtmann's principal problems in litigating the Woburn case was the indeterminate defendants problem. As Schlichtmann asked himself at the beginning of his involvement in the case: “Whose chemicals had polluted the wells? Who had dumped these chemicals, and when had they gotten into the water supply? Had they in fact caused leukemia?”58

Prior to the trial, Schlichtmann and UniFirst settled out of court for $1.05 million. Beatrice Foods, which had owned a tannery on the Woburn site and retained liability for the plant, was found not responsible for any contamination by the presiding judge.59

In 1986, after nine days of deliberation, the jury found W.R. Grace liable for contaminating wells G and H. Judge Skinner proceeded to throw out their verdict, though, on the grounds that he found some of their answers to the questions about the hydrogeological data to be confusing. Those questions they had been asked were asked by Judge Skinner himself, questions he would also later dismiss as overly confusingly worded.34

W. R. Grace ultimately settled with the families for $8 million, without having to admit responsibility for the contamination. Most of the money went toward legal fees. After years of turmoil, each family received less than $300,000 from the settlement.

I thought more positive things were going to come of it. In retrospect I guess that Grace really didn't have anything to lose, or hasn't lost much at all, even monetarily, or in any way, I guess. But when we settled, that wasn't necessarily the case, but as I get further away from it, I don't think that they really suffered much at all.

-Woburn mother after W.R. Grace settlement 34


The dollar amount of these settlements, while uninspiring, are illustrative of a broader set of challenges faced by the plaintiffs of environmental crimes. Economics scholar Harold Barnett documented these challenges in his book Toxic Debts and the Superfund Dilemma:

1. Some state statutes of limitations for tort actions begin to run at the time of defendant’s tortious act. These traditional periods are often violated by the time required for toxic waste leakage and migration, for exposure to contaminated surface or ground water supplies, for the onset of an injury such as cancer with long latency periods, and for awareness of the relationship between exposure and injury.

2. While several tort law principles such as strict liability, negligence, trespass, and nuisance are available in theory, the fact that the plaintiff may be indeterminate renders them inapplicable. We may know that a group of people has a specific type of cancer and that some of them contracted that cancer from exposure to the defendant’s waste; however, we will not know which individuals in that group were affected by the waste.

3. A defendant will be held liable if it is proven to be more likely than not that the defendant’s action caused the plaintiff’s injury. A plaintiff, however, typically can show only a causal link between exposure to a toxic substance and an injury. Further, medical and epidemiological evidence linking contamination to injury in a statistical sense may be excluded by evidentiary rules. Causal indeterminacy imposes great difficulties on the party with the burden of proof. High transaction costs combine with the uncertainty of eventual recovery to discourage many victims from suing and to encourage many who do sue to accept settlements which do not reflect the merits of their claim.60


If no organism exists nor forms independent of their environment, and proximity to toxic waste sites has a measured impact on one’s health outcomes, then a system in which some humans are left with no alternative but to live close to contamination sites would seem to most observers as distinctly unequal.

This makes FACE a particularly valuable case study of community advocacy for environmental justice, as their organizing had convinced not just Woburn residents but casual to onlookers to demand government action. In their book No Safe Place about the incident, Phil Brown and Edwin Mikkelson write—

Organizing a community contaminated by toxic wastes is extremely difficult and full of contradictions. The victims and their families, already suffering physical and emotional pain, must relive painful memories as they delve into the causes of their trouble… The Woburn community organized on a different pattern from most other toxic waste sites. Elsewhere we often see either a single community organization (as in Legler, New Jersey) or competing community groups with separate memberships (as in Love Canal). Alternatively, we may see a group composed of persons who have suffered specific health problems (as in Hardeman County, Tennessee).

Politicians such as Senator Edward Kennedy, Representative Edward Markey, state representative Nicholas Paleologos, and state senator Richard Krauss helped spread the word about the Woburn situation.

Still, Woburn's ascent to national significance must eventually be credited to conscious organizing efforts by the victims and their neighbors. They took “favorable” circumstances, created more of their own, and wove events into a tight web. In most other contaminated communities, victims fail to counteract government stonewalling. Woburn victims and their supporters showed unusual courage and persistence in withstanding so much hostility, obstruction, inaction, and ineffective action.34

As one of the victims’ father remarked—

What we did was a start, I think. That is square one. It did show the people out there that if you are wronged by a corporation that arbitrarily pollutes your water or your yard or your air or something like that, that, yes, there is an avenue that you can pursue to bring about a just [solution]—to cease it.34

___

Part 4: Winchester

Contents

map2png

Winchester, MA show in the top left of the Mystic River Watershed.61

Winchester is situated directly south of Woburn, and the Aberjona River likewise flows  southward from Woburn through Winchester toward the Mystic Lakes. Renown by early settlers for its natural beauty, Winchester’s early economic development largely hinged upon mills along the lotic water of the Aberjona. The Aberjona River, which is now centuries removed from being safe to swim in, is a center feature in the city’s well documented past.

While tangential from the topic at hand, I feel compelled to share witht the reader one of the more noteworthy stories about the Aberjona River, as described in the 1936 History of Winchester, published by the town themselves— “There ought somewhere to be recorded the sad story of Tufts Richardson, a descendant of Ezekiel, who met his end by drowning himself in the Aberjona on November 16, 1826. Hardly six months before, the young man had taken unto himself a wife with whom, however, he seems to have lived unhappily. We have it on the authority of his kinsman, Nathaniel A. Richardson, who was a small boy when the suicide occurred, that its cause was this: Tufts’ wife Mary had baked a number of loaves of brown bread, some of which turned sour before they were eaten. The young wife told her husband he must eat them up before any more loaves were baked. He refused; she insisted. In the end rather than eat the sour bread the harassed husband went out and threw himself into the river —perhaps the only case where a man carried his criticism of his bride’s cooking to so desperate a length.”62

Winchester, like Woburn, was dominated by leather tanneries and machinery manufacturers in the 19th century. Indeed, the Beggs & Cobb Tannery in Winchester was purported to be the largest tannery of upper leather in the world by the late 1890s.4

A 2017 report written by historian Ellen Knight for the town of Winchester chronologued the history of industrial development along the Aberjona.63 In it, Knight showcased quotes from early 20th century town planning documents regarding water quality along the Aberjona—

1911: “*River channel at Manchester Field was shallow because of material washing into the stream, and the original river channel…Along the shore were many dead eels, and the river was covered with scum at several points. Many street drains emptied into the river. The channels around the islands were almost filled with accumulations of street washings.*”

image25jpeg

Exterior of Algonquin Tannery on Abjerona River from 1922 Mass. Fish & Wildlife report32

1928, Judkins Pond (aka Black Ball Pond) ‘is a shallow flowed area, nearly dry in the summer months. … All about the Pond cat tails and other growths hold water in puddles forth propagation of the mosquitoes’ …

*‘Judkins Pond…some fifteen acres are covered to a depth estimated at sixty feet, with a liquid of about the consistency and appearance of black bean soup.’*

At the northwest end was an ash dump. In the summer the pond could be nearly dry.

1928, Cranberry Bog conservation area: Above the cranberry bog the land is low, with a dug canal overflowing at spots into the original Aberjona River bed. Beyond the town line is the Atlantic Gelatin Company Works, with its large area of settling beds and piles of waste material. This deposit must have accumulated for years; the whole hillside and low-dyked areas are covered with the lime-colored, sticky mess, the land appears to be saturated and evidently seeps into the Aberjona River and is washed out in time of heavy rain.

image26jpeg

Photo of surveyors from a 1922 Mass. Fish & Wildlife study of Aberjona River Pollution32

1932, Leonard Pond [now Leonard Field]: Across the river, the J. O. Whitten Co. Gelatin Works was ‘dumping sludge refuse upon their property, near the margin of the stream.

Located at 50 Cross St., the McLetchy Japanning Factory, was ‘also dumping wastes upon the low, wet areas.’

Park commissioners announce plans that ‘In place of swamp lands and mosquito-breeding marshes, there will be attractive self-draining park lands, with ponds that will be suitable for bathing and canoeing in summer and skating in winter.’

1935, Leonard Pond: Aforementioned beach closed. The metropolitan sewer frequently overflowed into the river, which originally fed the pool. The state Board of Health closed the pool.

1938, Leonard Pond: The swimming area is cleaned out by pumping out the water, removing two to four feet of sewerage sludge and mud, and spreading out clean sand.

1953, Leonard Pond: [Swimming area] closed due to pollution, apparently from the state sewer line.

1955, Aberjona River during Hurricane Diane: *The Water and Sewer Department worked until Sunday night on sewers which were overtaxed because people had opened sewer caps to drain cellars. In violation of the law, uncapping of sewers filled Winchester’s mains with more water than they could handle. Some people were shocked when they pulled open sewer caps and sewage water began running into their basements*.


“This river of ours has to be seen, and smelled, to be believed.”

image27png

Winchester Star, June 22, 195663


1986, Leonard Pond: Swimming area pumped dry, cleaned, and provided with new sand; reportedly it had the 'clearest water in many years.'

1990, Leonard Pond: Closed for swimming permanently.62


By the second half of the 20th century, Winchester began transforming into a disproportionately affluent community, due in large part to easier highway transportation to and from the city. A 1982 report published by the Massachusetts Historical Commission explained—

Here too, residential development was primarily responsible for the expansion. In this case, however, greater affluence resulted in the construction of mostly single-family houses. In towns like Milton, Newton and Winchester, neighborhoods of fashionable, and occasionally pretentious, houses grew up. Around these developed small commercial centers, country clubs and other middle-class support services.

In the outer suburban areas of Boston's regional core, residential development was characterized by greater affluence and lower density than housing in the inner suburban areas… This kind of affluent development took place in towns like Milton, Brookline, Newton, Belmont, Winchester and Winthrop.4

On the consequences of the societal shift towards suburban living, the Commission’s report continued—

In the same way that automobiles modified public recreational interests, they began to re-orient settlement. Particularly with construction of entirely new highway systems, such as Route 128, industrial as well as commercial and residential development became feasible, even attractive, in areas that previously had experienced little or no development interest. It would require several decades before the full implications of this shift became evident.4

Today, Winchester is known more for its ornate residences throughout the town than for its history as a major manufacturing hub.

Households in Winchester, MA had a median annual income of $152,196 in 2017,64 which is more than the median annual income of $60,336 across the entire United States. 99% of the population of Winchester, MA has health coverage, with 72.5% on employee plans, and 3.35% on Medicaid. 83% of its residents are white alone and 12% are Asian alone.64


Part 5: Race as a Risk Factor

Contents

African American and Latino communities are overrepresented in the majority in communities that border hazardous waste sites within the United States. Environmental inequalities exacerbate already marked levels of socioeconomic inequality across race, for several reasons.

Zoning

More than 30 years ago in 1987, the United Church of Christ’s Commission for Racial Justice released a report assessing US population demographic characteristics in areas near hazardous waste sites. Their findings, sourced from US Census Bureau and EPA data, illustrated some of the most overt examples of institutional racism by way of land zoning —

  • Communities with the greatest number of commercial hazardous waste facilities had the highest composition of racial and ethnic residents. In communities with two or more facilities or one of the nation's five largest landfills, the average minority percentage of the population [In this report, 'minority percentage of the population' was used as a measure of 'race'] was more than three times that of communities without facilities (38 percent vs. 12 percent)
  • Three out of the five largest commercial hazardous waste landfills in the United States were located in predominantly Black or Latino [as documented by the census] communities. These three landfills accounted for 40 percent of the total estimated commercial landfill capacity in the nation.
  •  Three out of every five Black and Latino Americans lived in communities with uncontrolled toxic waste sites.65

Twenty years later in 2007, their report Toxic Wastes and Race and Toxic Wastes and Race at Twenty showed underwhelming progress —

  • In metropolitan areas, where four of every five hazardous waste facilities are located, people of color percentages in hazardous waste host neighborhoods are significantly greater than those in no host areas (57% vs. 33%)
  • More than 870,000 of the 1.9 million (46 percent) housing units for the poor, mostly minorities, sit within about a mile of factories that reported toxic emissions to the Environmental Protection Agency.
  • More than 600,000 students in Massachusetts, New York, New Jersey, Michigan and California were attending nearly 1,200 public schools, with largely African Americans and other children of color, that are located within a half mile of federal Superfund or state identified contaminated sites.66


image28jpeg

Indices of black-white segregation in Northern cities, 1860–1970 67


Misperceptions of American Progress in Racial Equality

From its beginnings in America, the chief dilemma of liberal democracy has been this war between liberty and power. Because each is defined by the absence of the other, they cannot be disentangled; because each jeopardizes the other, they cannot be made to coexist.68

Americans who are not already exposed to these living conditions tend to not go out of their way to observe them, and thus will tend not to see the racial disparities of housing in the country. Moreover, there is a body of evidence pointing to a common misperception, one held primarily by white Americans, that the country has made far more significant strides in the realm of racial income inequality than it actually has.

A study published in 2019 by Yale University’s Institute for Social and Policy Studies surveyed a nationally representative sample of 1008 black and white adults about how they perceived the average income of a white family as compared to the average income of a black family, for 12 different years spanning from 1963 to the current year (survey responses were gathered between 2013 and 2016).

Specifically, the survey asked — 

 “If the typical White family had 100 units of each of five economic categories (i.e., income, wealth, employer-provided health benefits, wages among high-school graduates, wages among individuals with college degrees), how much would the typical Black family have?69

Participants responded using a 0-to-200 scale on which a response of 100 indicated racial equality¹. Analyses of participants’ perceptions of Black–White wealth disparities revealed a substantial underestimation of the racial wealth gap at all 12 time points —

To further contextualize these estimates, we examined frequencies of estimates of the Black–White wealth gap when aggregated across the 12 time points. In this analysis, 97.4% of respondents overestimated Black–White wealth equality by some nonzero amount, 94.5% overestimated equality by 10 or more percentage points, 89.3% overestimated equality by 20 or more percentage points, and 61.5% over-estimated equality by 50 or more percentage points.69

image29png

Source: Kraus, Rucker, & Richeson69

There has been a wide array of research and scholarship published over the past two decades into Americans’ perceptions and misperceptions of racial equality that show similar findings. (For example— Are Emily and Greg More Employable Than Lakisha and Jamal? A Field Experiment on Labor Market Discrimination, Bertrand & Mullainathan 2004. Ignorance of History and Perceptions of Racism: Another Look at the Marley Hypothesis, Strickhouser 2018. Simply insane? Attributing terrorism to mental illness (versus ideology) affects mental representations of race, Kunst, Myhren, & Onyeador, I. N. 2018. Toward a Social Psychology of Race and Race Relations for the Twenty-First Century, Richeson & Sommers 2016. Racial color blindness: emergence, practice, and implications, Apfelbaum, Norton, & Sommers 2012. The rules of implicit evaluation by race, religion, and age, Axt, Ebersole, & Nosek 2014. Racial formation in perspective: connecting individuals, institutions, and power relations, Saperstein, Penner, & Light, 2013. The devil is in the details: Abstract versus concrete construals of multiculturalism differentially impact intergroup relations, Yogeeswaran, Kumar,Dasgupta, & Nilanjana 2014.)

One particularly relevant observation of this specific study, though, is how one’s ‘frame of reference’ for a given exemplar of a demographic differs depending on the context—

It is possible that the same perceivers are motivated to both overestimate racial equality in the service of narratives of racial progress while also endorsing beliefs that justify the lower-status position of racial minorities, such as the overrepresentation of Black and Latinx Americans in the U.S. carceral system.69

Countless studies have shown race has far wider correlations with one’s social outcomes than does class. Race is a greater determinant than class in whether one is exposed to environmental hazards and trauma, where one lives, what schools one attends, whether one is stopped by the police, who gets arrested, who juries are most likely to convict, who is more likely to get the death penalty, and how long someone is likely to live.70

The overrepresentation of non-white residents within the most ecologically damaged and/or lowest income communities in the country is self-perpetuating. When specific populations are left with no choice but to live in a specific neighborhood, those tend to be the ‘bad neighborhoods.’ (See Richard Rothstein’s The Color of Law for a comprehensive inquiry into the topic of the lingering societal and structural inequalities that have resulted from historical racially defined zoning.)


To be a poor man is hard, but to be a poor race in a land of dollars is the very bottom of hardships. - W.E.B. Du Bois71


The Massachusetts Executive Office of Energy And Environmental Affairs (EEOEA) produces mapped data sets that correlate US Census Demographic data with Massachusetts communities. The EEOEA established a criterion by which to group ‘Environmental Justice Populations’ if any of the following are true:

  • Annual median household income is equal to or less than 65 percent of the statewide median ($62,072 in 2010); or
  • 25% or more of the residents identify as a race other than white; or
  • 25% or more of households have no one over the age of 14 who speaks English only or very well  (“English Isolation”)

As shown in the map below, these classifications are quite widespread within the region surrounding Encore Boston Harbor.

image30png

Adapted by the author from Google Earth, 2019. Data on populations from Census 2010 Environmental Justice Populations, superimposed on map using data from the Bureau of Geographic Information (MassGIS), Commonwealth of Massachusetts, Executive Office of Technology and Security Services, 2019

The Census Bureau’s 2017 American Community Survey documented that:

  • 26.5% of children in Chelsea, MA lived in households with incomes beneath the poverty line, versus just 3.8% in Arlington
  • 24% of Everett residents are black, versus less than 1% in Winchester
  • More than half of Malden residents speak a language other than English at home, while nearly 80% of Woburn residents speak solely English at home

Drilling specifically into how the communities of Everett and Chelsea relate to other municipalities in the state provides further context. 13.9% of Everett residents live below the poverty line (just $25,465 for a family of two parents and two kids, according to data published by the US Census Bureau), more than 20% higher than the state average. Next door, 19.5% of Chelsea residents live below the poverty line, 75% higher than the state average.72 The correlation between the disproportionately high levels of poverty in these two cities and their racial makeup is the subject of the rest of Part 6.

image31jpeg

Everett

The Encore Resort at 1 Broadway in Everett, MA— however disruptive to the surrounding neighborhoods it may be when operational—is likely among the least disruptive occupants of the land parcel in centuries. As with the Woburn IndustriPlex in the late nineteenth and early twentieth centuries, factories and biochemical plants rapidly expanded in the lower end of the Mystic River.

Large parts of Everett and Chelsea—originally saltmarsh— were transformed by industry and railroads. In contrast to Woburn, these cities had the additional ecological burden brought from being New England’s preeminent shipping and rail terminals. The Massachusetts Historical Commission detailed in a 1982 report—

As the distribution center for much of New England, Boston's waterfront had long been cluttered with wharves and warehouses. During the last half of the nineteenth-century these were joined by vast coal yards which held the reserves required to fuel the railroads, steamships and power generating plants. New technologies required new fuels and by the early twentieth-century, another series of storage facilities, this time for oil, kerosene and other petrochemicals was established. This kind of terminal fringe developed in East and South Boston, Charlestown and Everett.4

image32jpg

Adapted by the author from 1830 map of Boston and adjacent towns, present site of Encore Boston Harbor annotated with star73

The 1912 Historical Register published by the neighboring city of Medford chronologued the evolution of the 1 Broadway plot of land, though Everett had only been incorporated as a city in 1892. The land originated as a part-time island, depending upon the tides. The earliest recorded owner of the parcel was Sam Swan, who had purchased it directly from the town of Charlestown. During low tide, he would pick the vegetation growing on the sandbar and sell it to ‘a man in Reading, for $30 a year.’10

When Swan died in 1825, he bequea